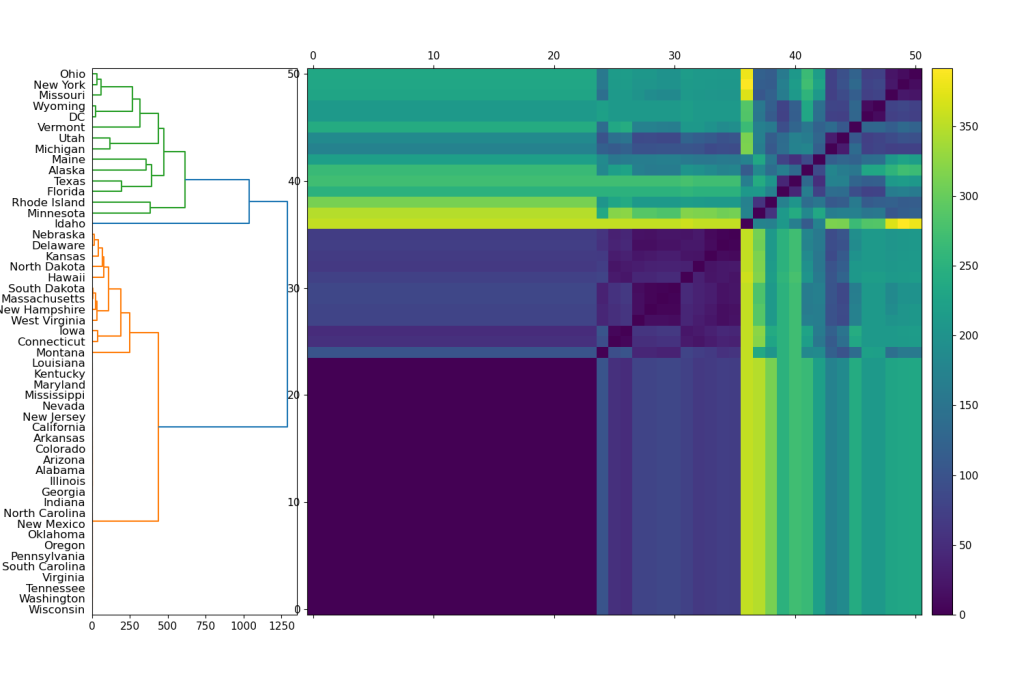
Only a handful of states showed surge in gun violence incidents specific to summer of 2020, contradicting reports of national trend.
From the Journal: Chaos

WASHINGTON, Nov. 1, 2022 – Although gun violence is a challenging problem in the U.S., few in-depth statistical studies have been carried out on a state-by-state basis. In Chaos, by AIP Publishing, mathematicians from the University of Melbourne and Tsinghua University provided a thorough analysis of gun violence incidents from early 2018 to mid-2022 in all 50 states and compared their results to historical events during that period.
The investigators analyzed data provided by the Gun Violence Archive, a nonprofit organization in Washington, D.C., that collects and verifies detailed, real-time data from law enforcement, government, and other commercial sources. They used a statistical method known as time series analysis that has illuminated the dynamics of events in a variety of fields, including epidemiology and finance.
The team paid particular attention to the summer of 2020 when the national media reported widespread violence due to a combination of COVID-19 shutdowns, the murder of George Floyd, and subsequent protests and unrest.
“Contrary to the national media’s reporting on trends in gun violence, when we looked at the data on a state-by-state basis, we found only a few states with a surge in gun violence activity specific to mid-2020,” said author Max Menzies of Tsinghua University.
Outstanding points in time, called “change points,” were identified with the time series analysis technique. These points occur when the number of gun violence incidents either increases sharply or decreases.
Using a method known as hierarchical clustering, the researchers identified three clusters of states. In the first cluster – 24 states in all – no discernable change points were detected in the entire period studied. A smaller cluster of 12 states showed only one change point, and this occurred in late 2021.
Only within the third cluster of states, just seven in number, is there a clear 2020 summer jump. The most striking evidence of this jump occurs in data from Ohio, New York, and Missouri. Minnesota showed a decrease before its summer jump.
“Some states, most of all Texas and New York, exhibited more violence post-2020 compared to pre-2020, but others, such as Florida and Massachusetts, exhibited less,” said Menzies. “We didn’t see any patterns in terms of red or blue states, which is another interesting finding of our work.”
Although U.S. gun violence has garnered significant media attention, mathematical research on the topic is sparse.
“We are unaware of any work that marries analysis of gun violence data in the time and frequency domain and hope our paper may catalyze further work in the area,” said author Nick James of the University of Melbourne.
###
Article Title
Dual-domain analysis of gun violence incidents in the United States
Authors
Nick James and Max Menzies
Author Affiliations
University of Melbourne and Yanqi Lake Beijing Institute of Mathematical Sciences and Applications, Tsinghua University
